Changelog
Follow up on the latest improvements and updates.
RSS
Similar Assets is an AI powered feature, it enables users to discover tables, views, and datasets with similar schemas across the entire data stack.

Displays the tables or views most commonly joined with the current asset, providing insights into data relationships and aiding in query optimization.

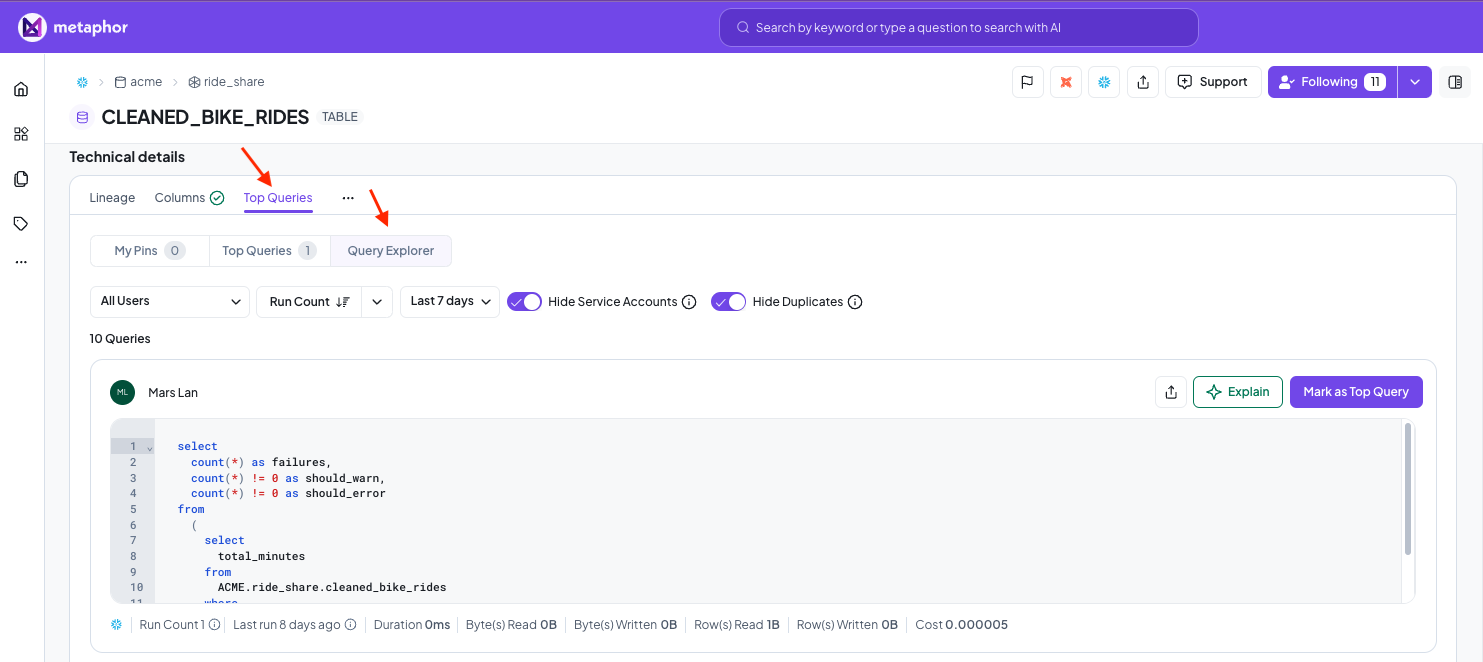
We've added a few filter and sort options to the Query Explorer tab (prev. Query Logs)
Users can sort by Run Count to find the most popular queries run against the table, select specific users to find their queries, or select a time range of Day, Week or Month to narrow the search range.
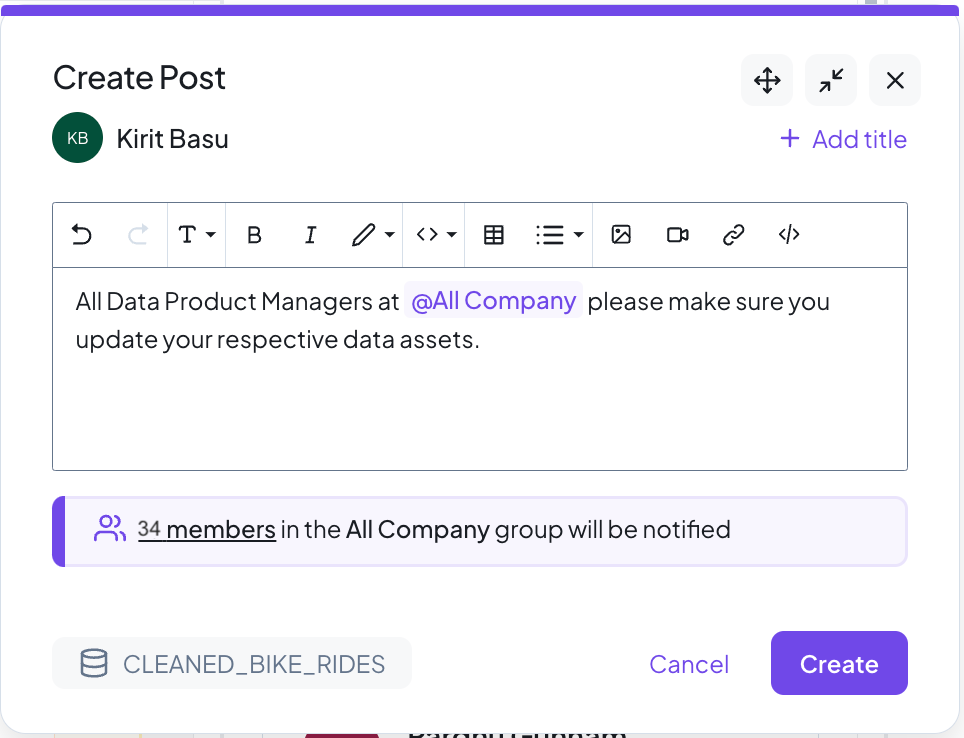
Metaphor supports automatic synchronization of groups from Entra (and Okta - coming soon).

Users can '@' mention groups in Posts to ensure that all members of that group will receive a notification.
In an upcoming release we expect to release support for SCIM synchronization with Okta. And the ability to enroll one or more person including a group to Follow an asset.
Metaphor natively supports Informatica Data Integration Services. Customers can use the built-in connectors or self-host the crawler in their own environment.

Metaphor natively supports Oracle DB. Customers using Oracle 19c and above can use the built in crawler or self-host the crawler on their own environment.

Incidents and Deprecation notices are given prominent placement and are displayed front and center on an asset page.
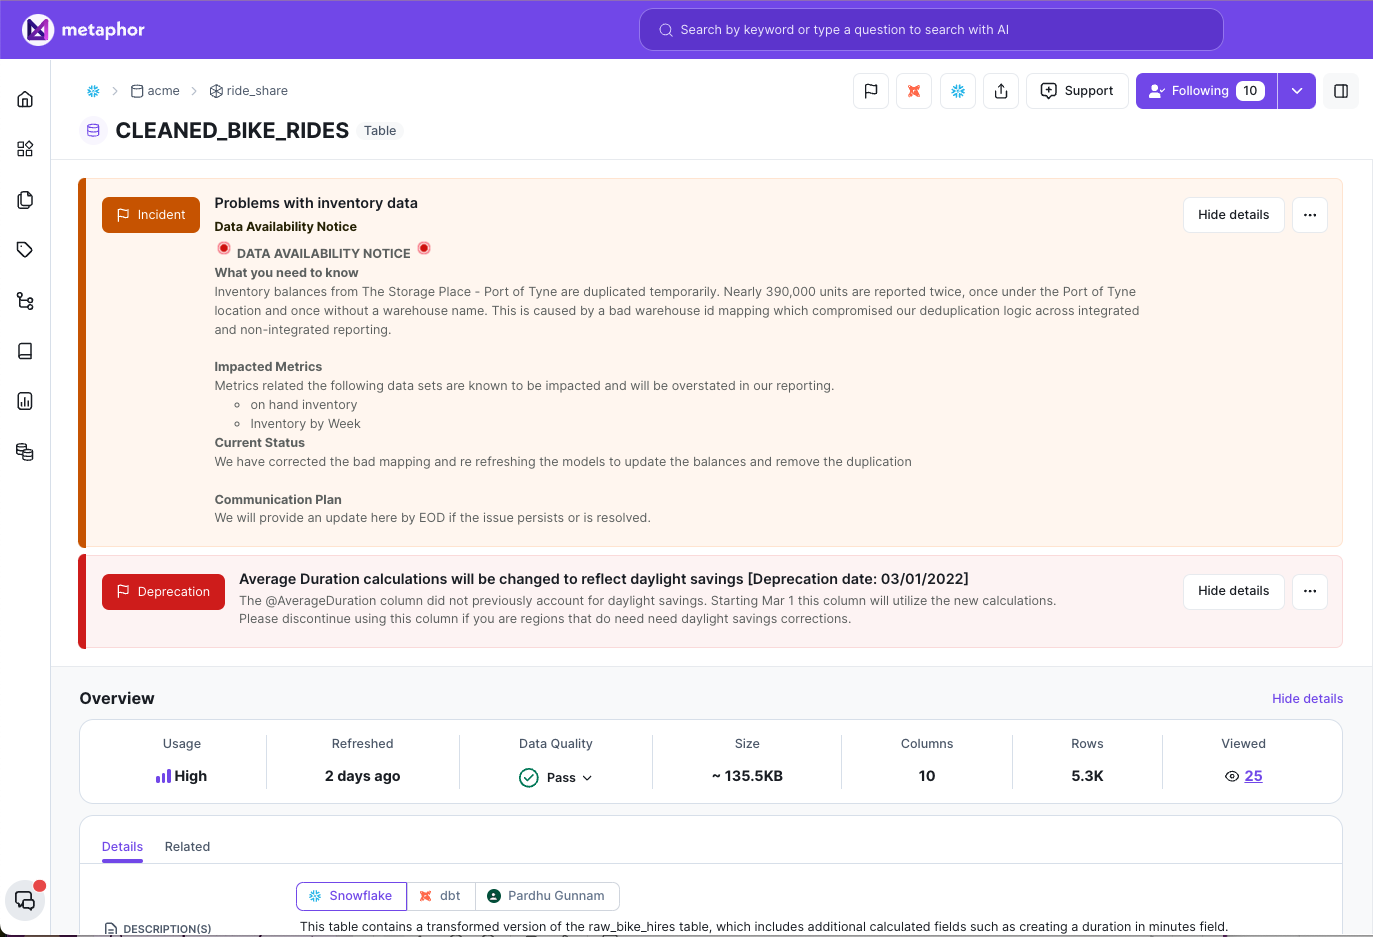
Data-admins can create notices on any asset.

Users can click the the Archived Notices to view older notices.

new
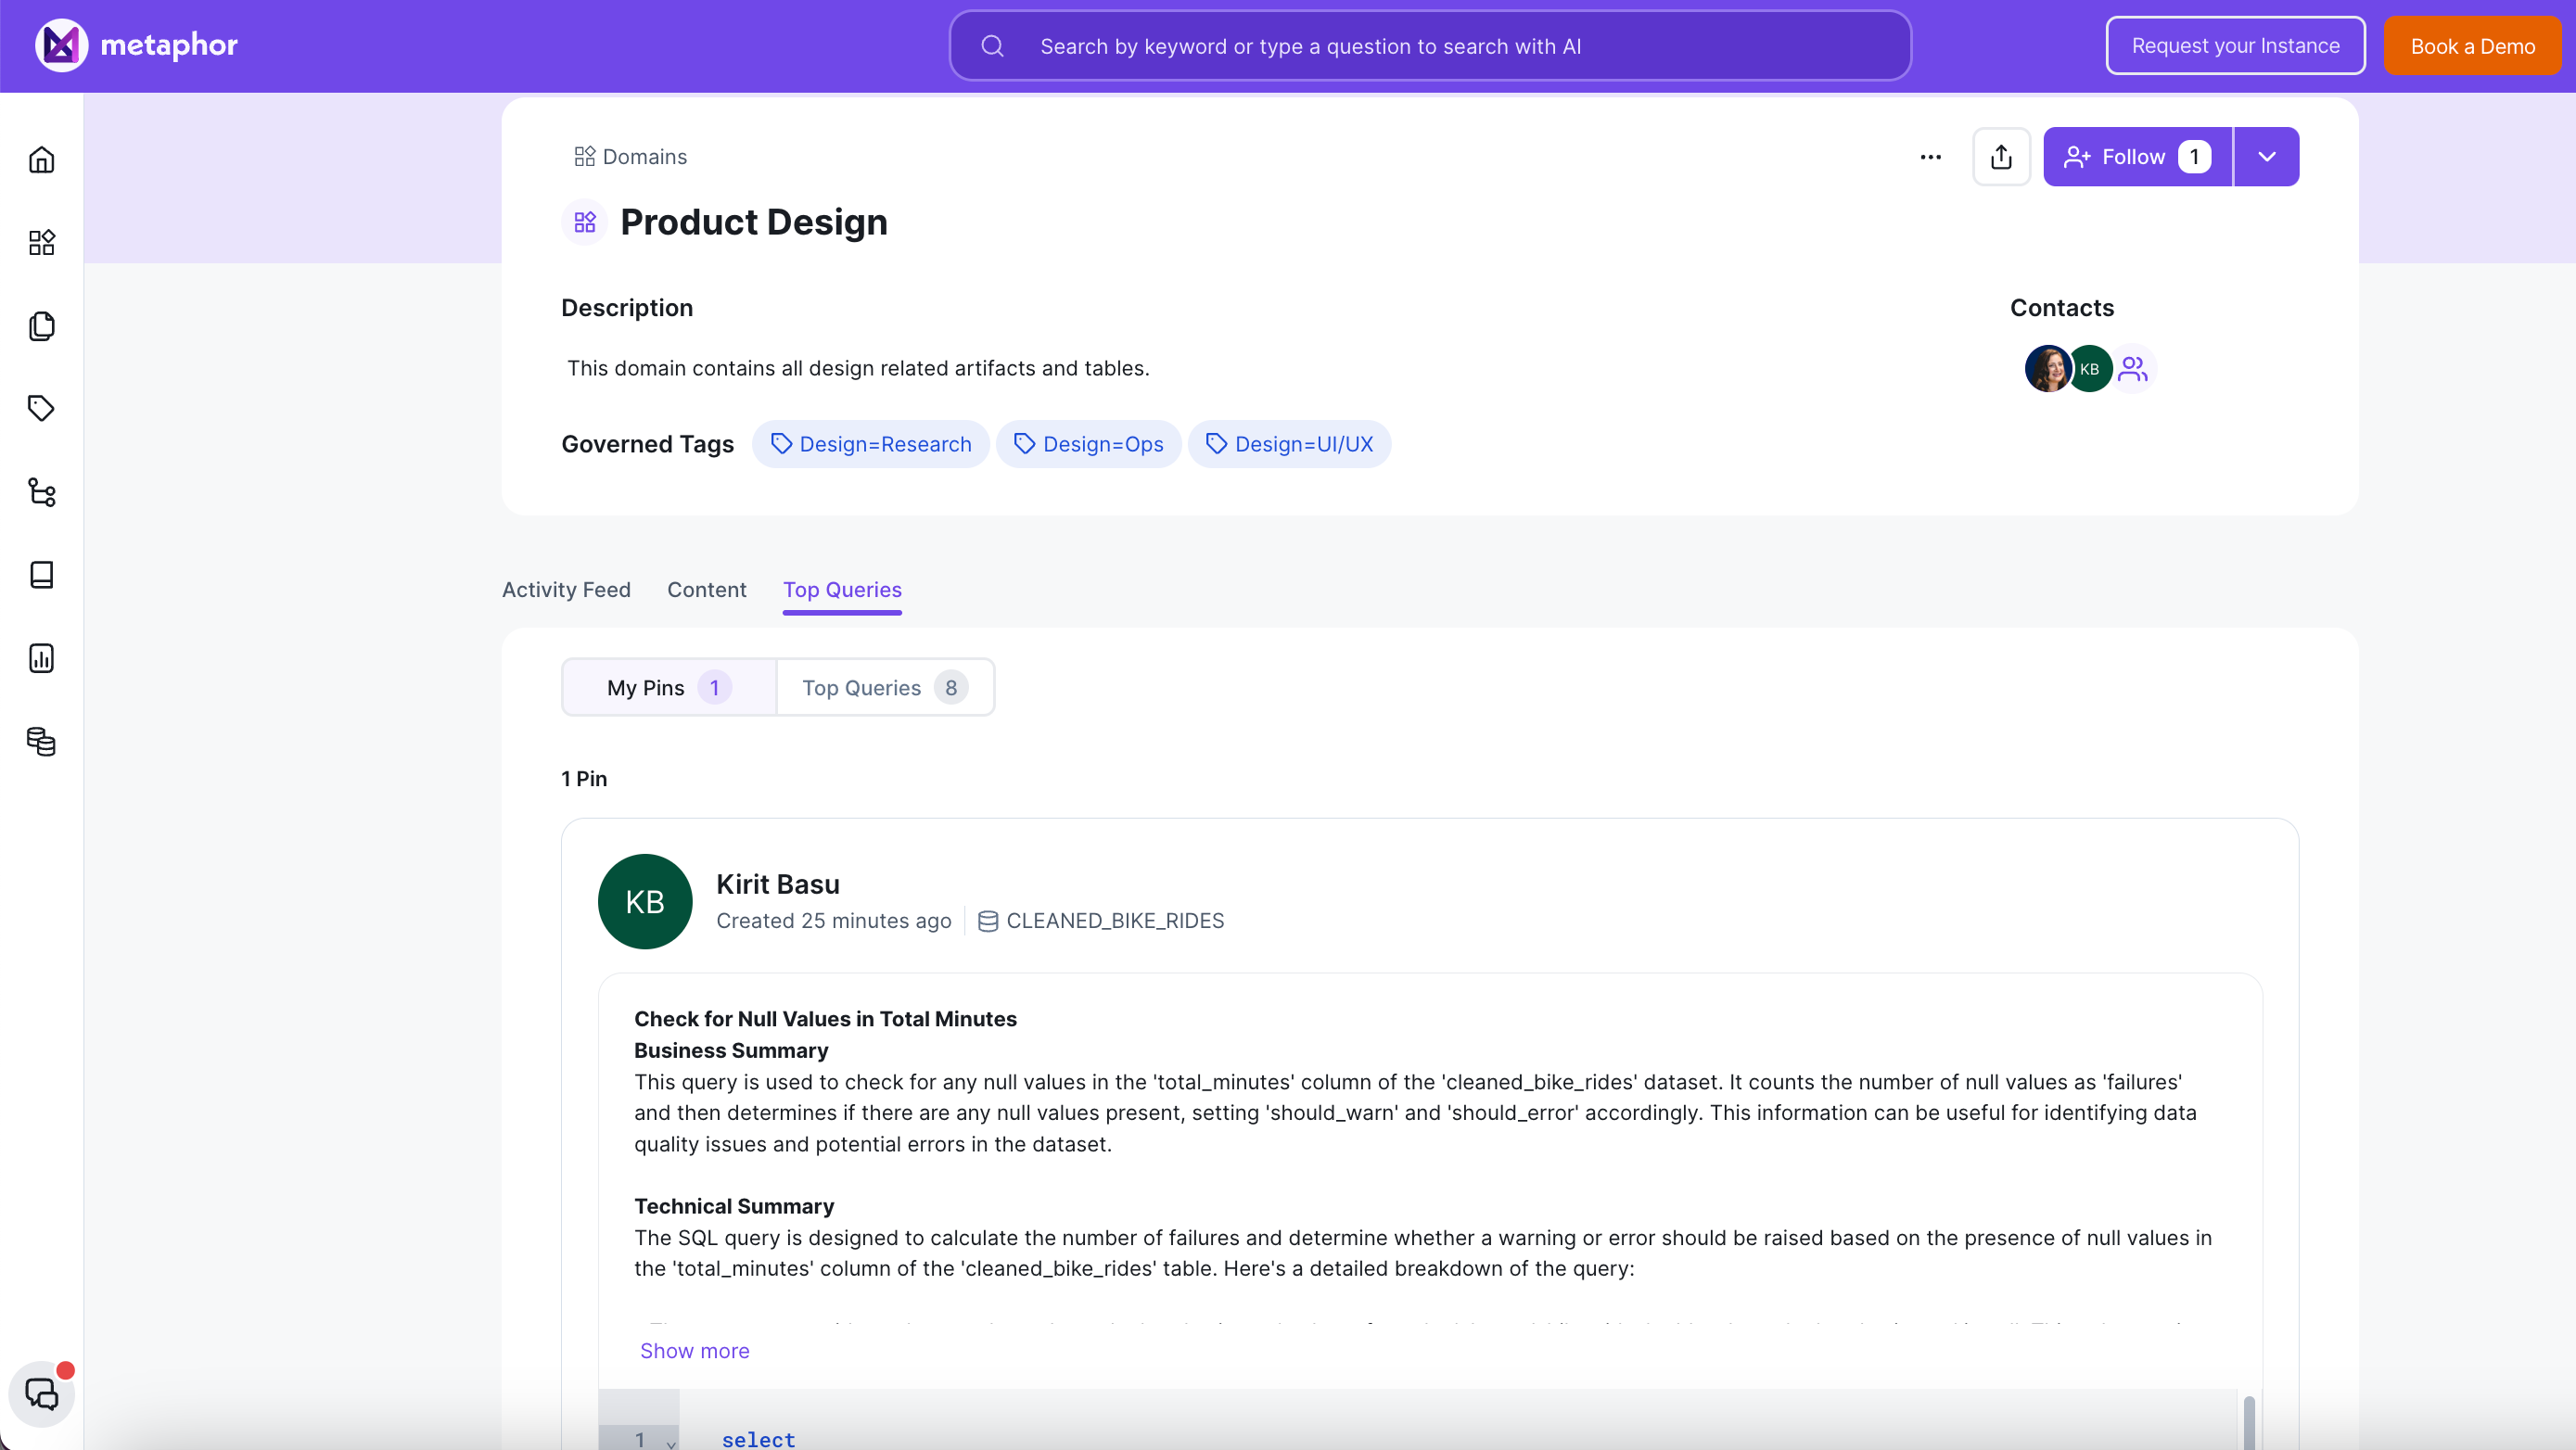
Top Queries
Top Queries are a curated list of the most interesting and insightful queries associated with a table or a data product.
Instead of sifting through a large query log everytime to find useful queries, asset owners can pick queries, create explainers using AI (or manually) and mark them as Top Queries.
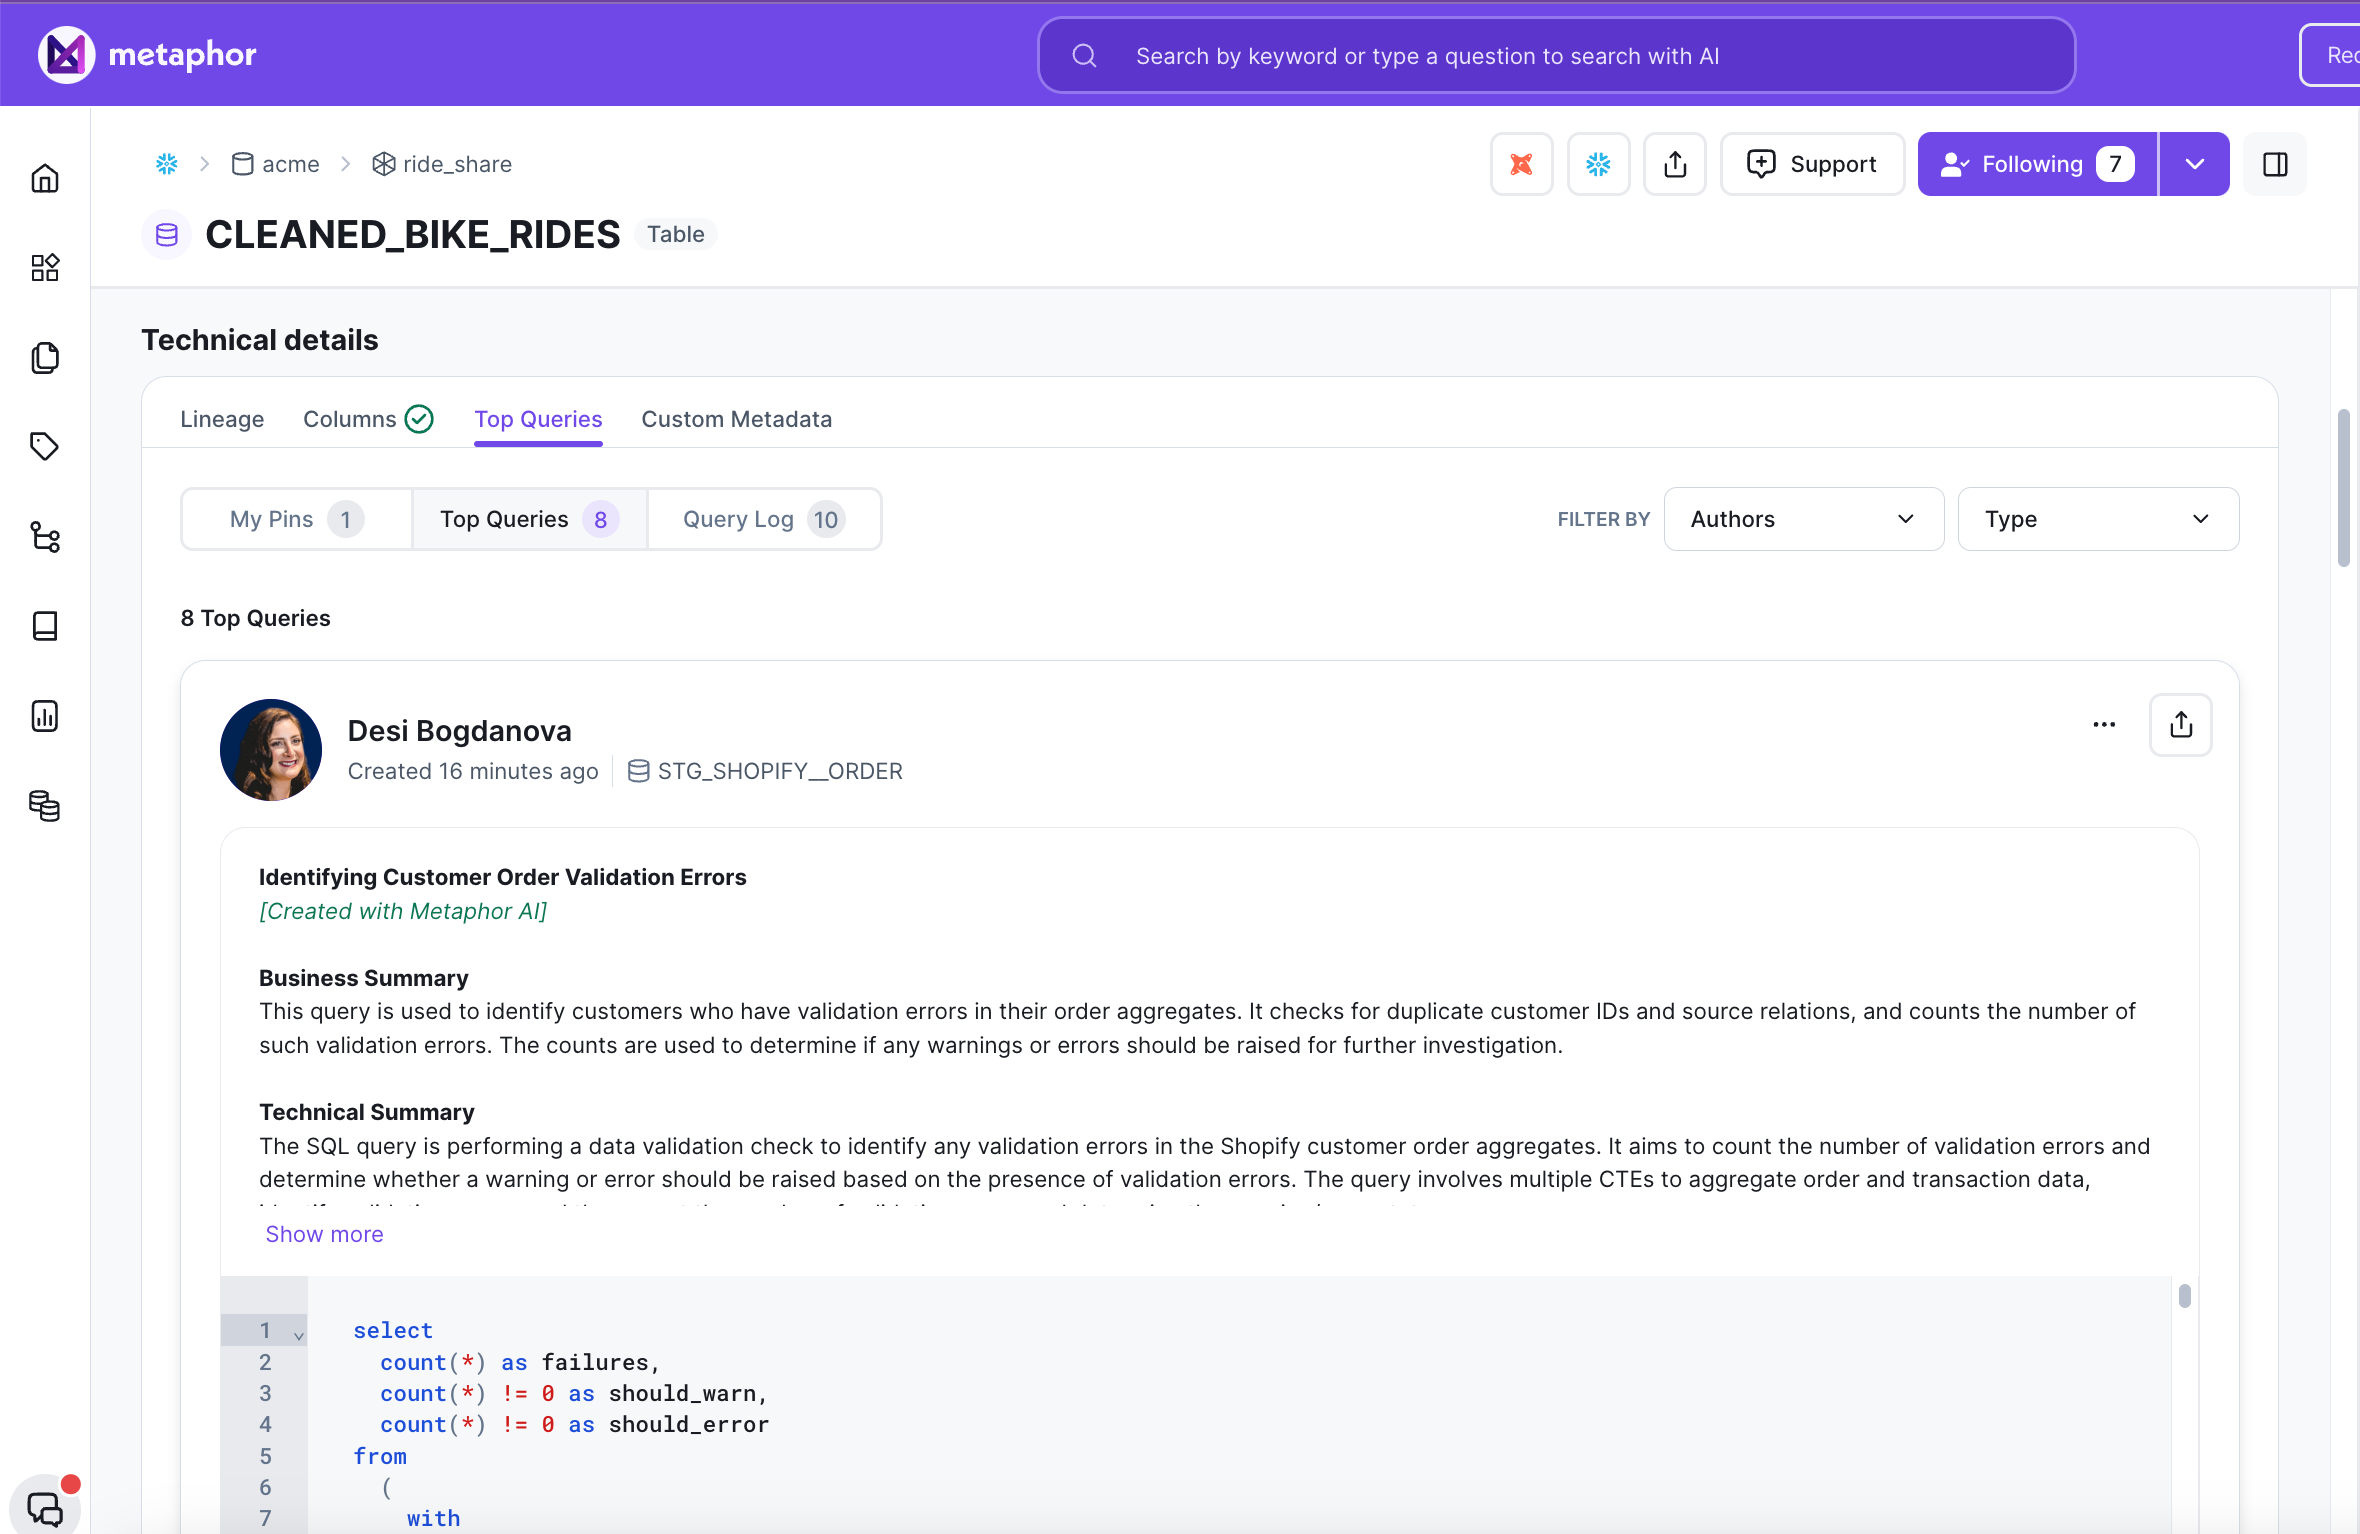
Top Queries show up at the level of an individual asset, or at a domain level.
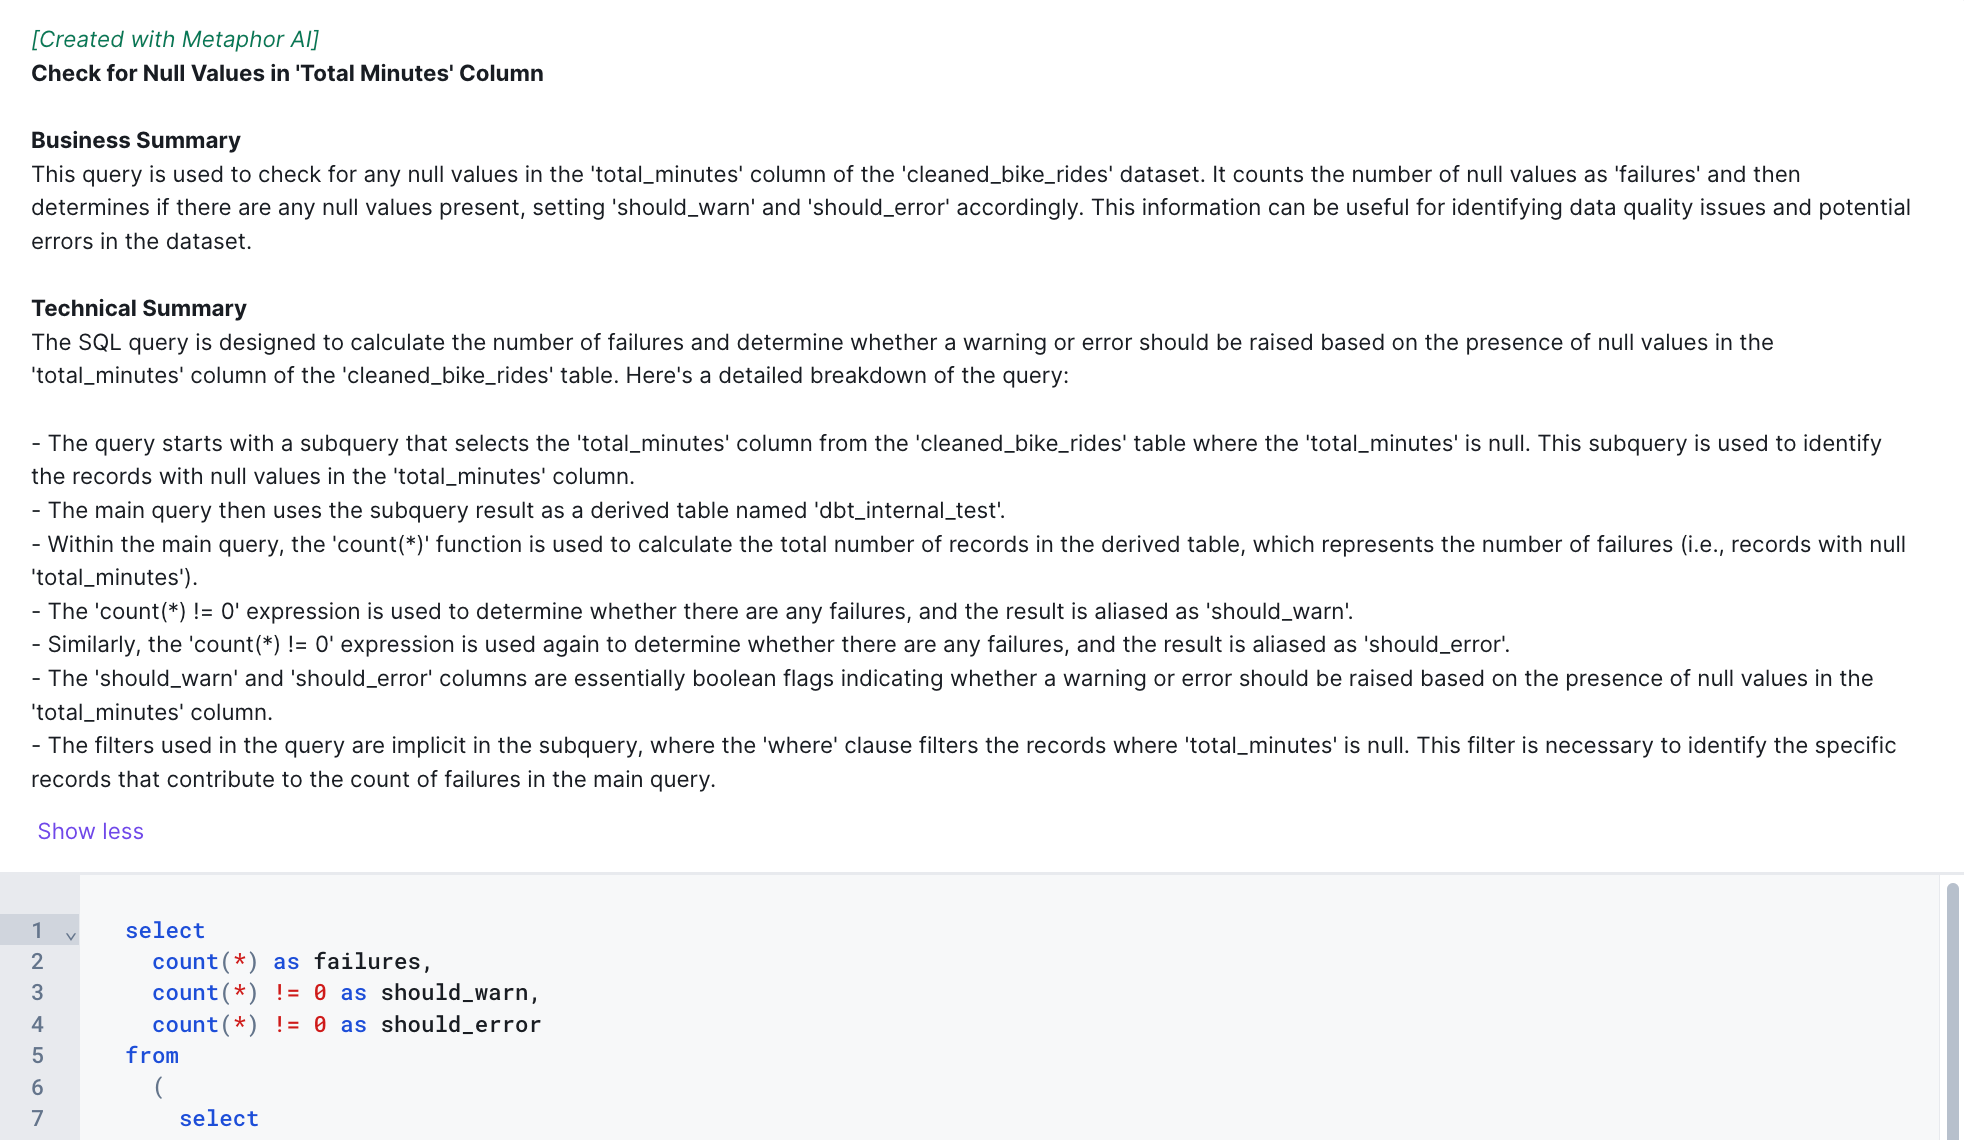
While browsing through a table's query log users can hit the 'Explain' button to get a detailed human readable explanation of that query.
Metaphor AI looks at context such as table/column descriptions and any related glossary terms and generates 2 summaries - A high level functional explanation that a business user may care about, and a deeper technical readout of the various logical steps of the code.
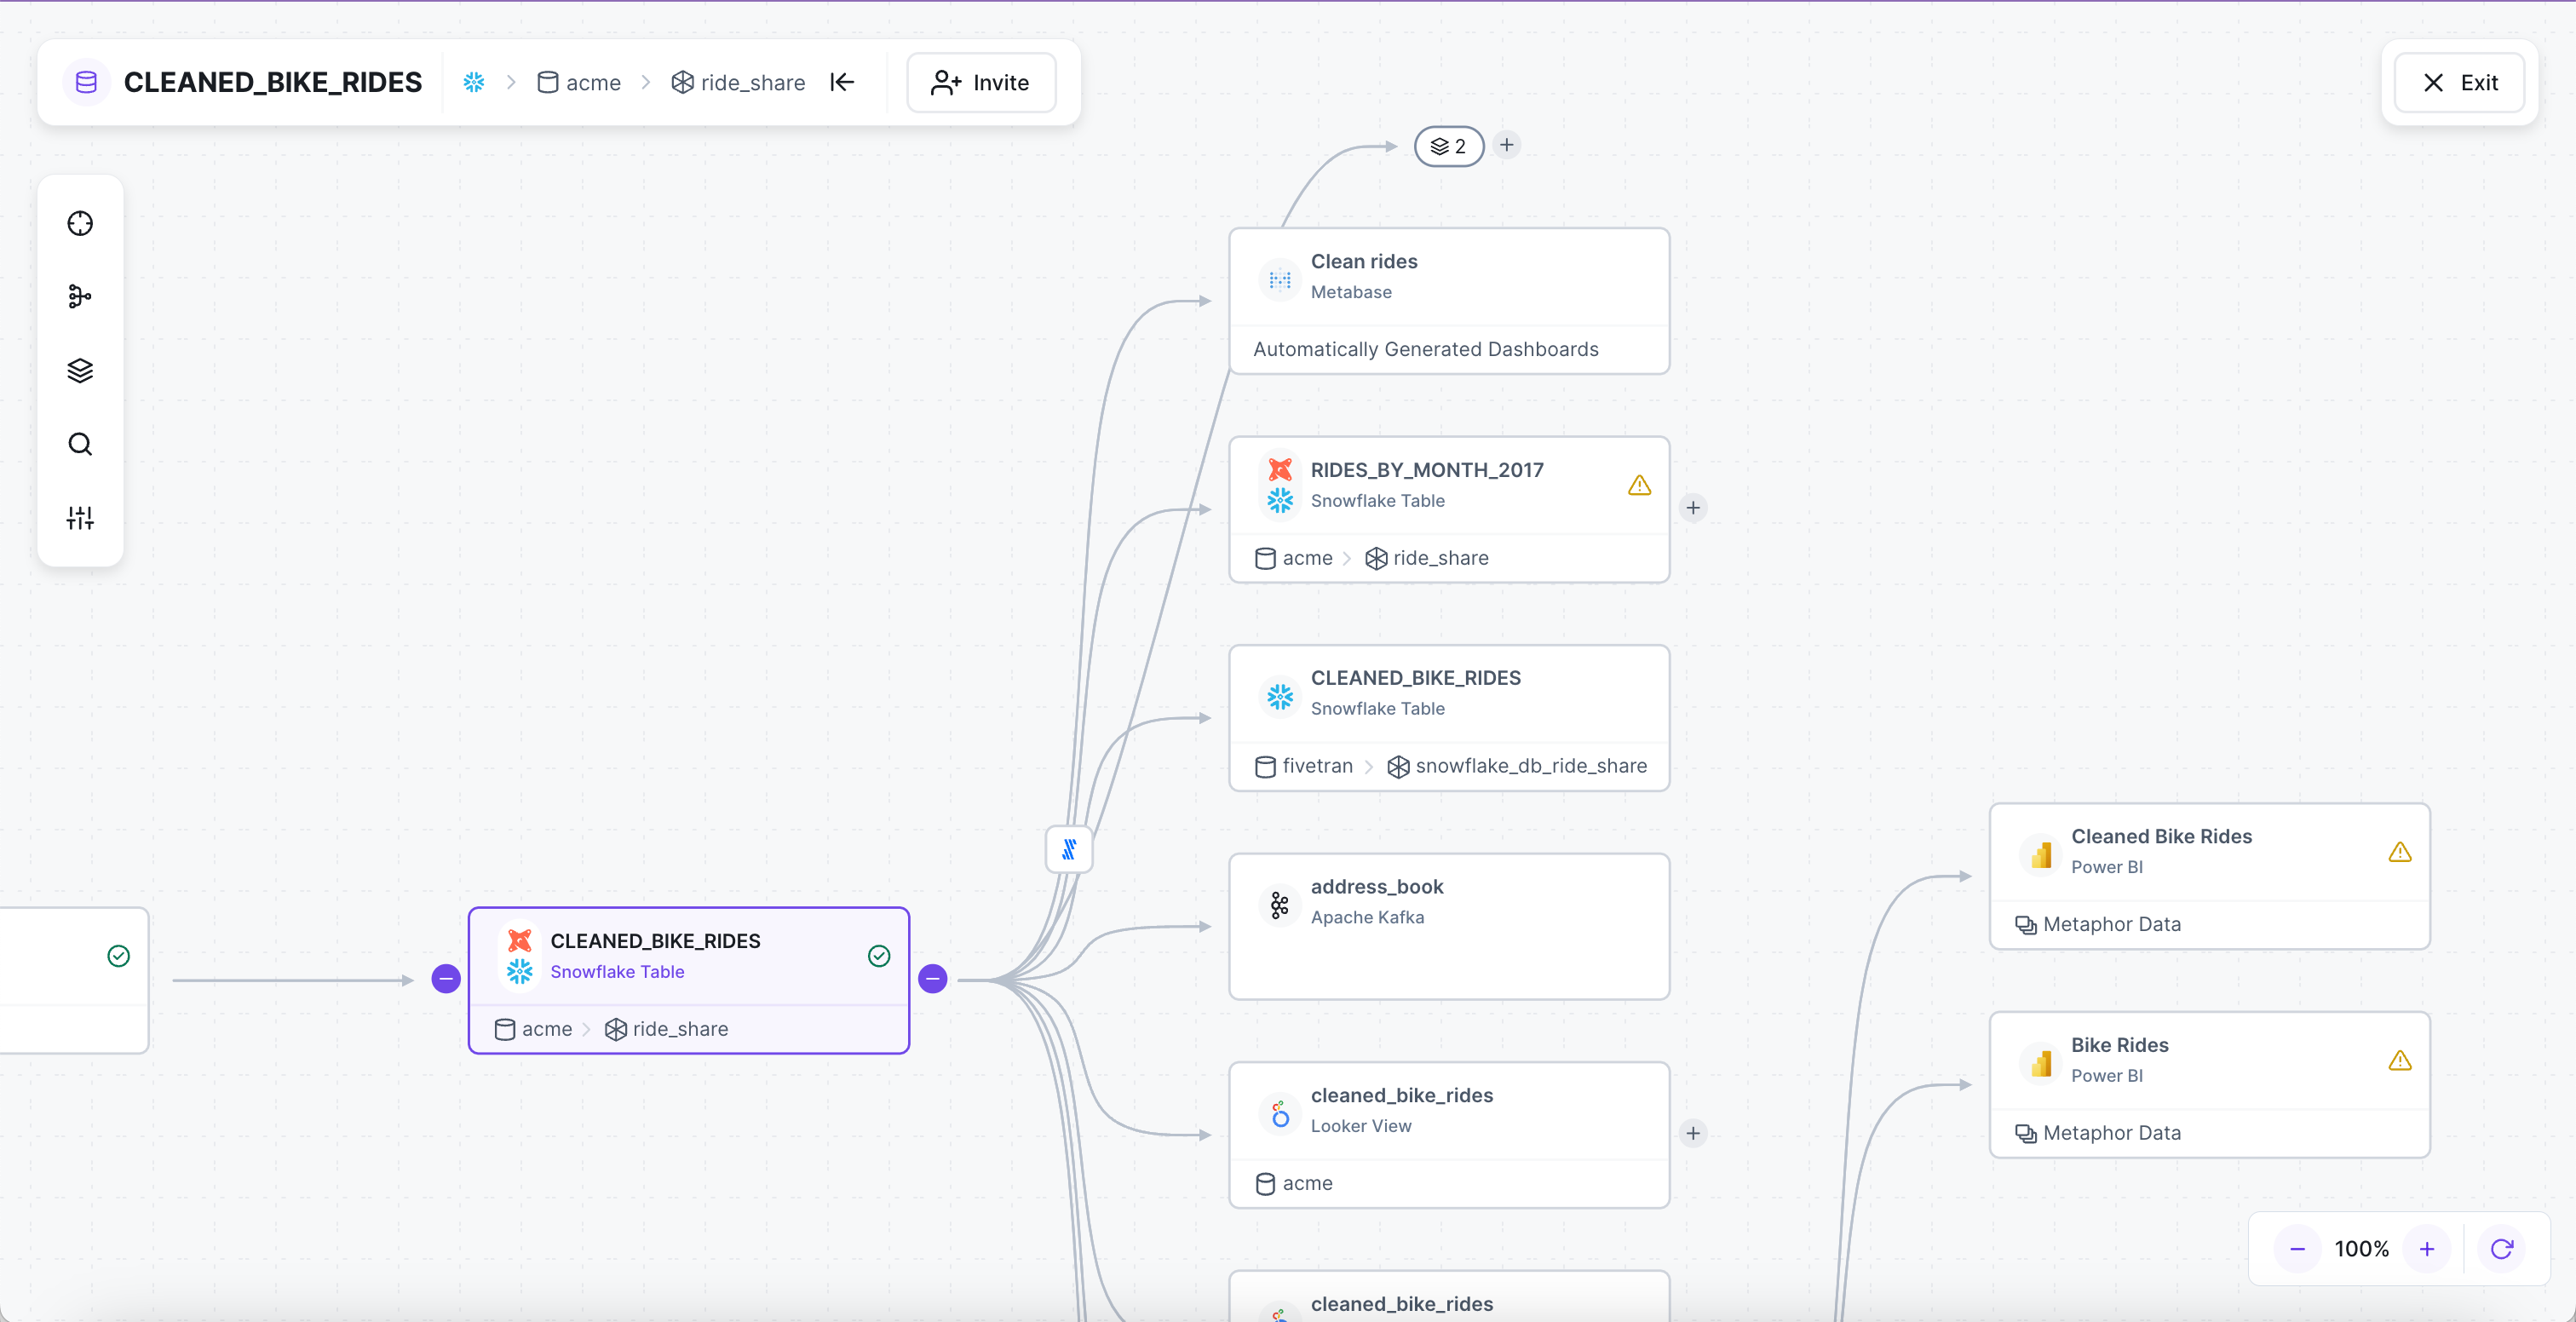
We've made several improvements to Metaphor Lineage to make it easier to navigate large and complex lineage graphs.
Full Screen Mode
Clicking the 'Open in full page' link

Lets you navigate the canvas using the full real-estate of your browser window.
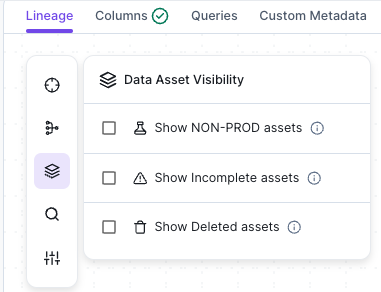
Hide Non-Prod/Incomplete/Deleted Assets
For customers that have a lot of non-prod assets e.g. tmp tables etc, the lineage default collapses these assets.

Selecting the collapsed node will display a list of those assets on the right hand side.
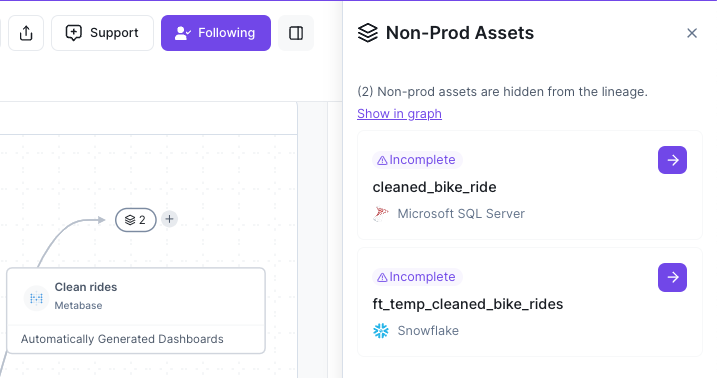
And if you'd like to see those nodes inside the graph you can choose the Data Asset Visibility option in the Overlay bar to enable them.
Show underlying query
Clicking on a node displays not only the underlying DDL query, but where applicable you can also see the dbt Source and Compiled query.
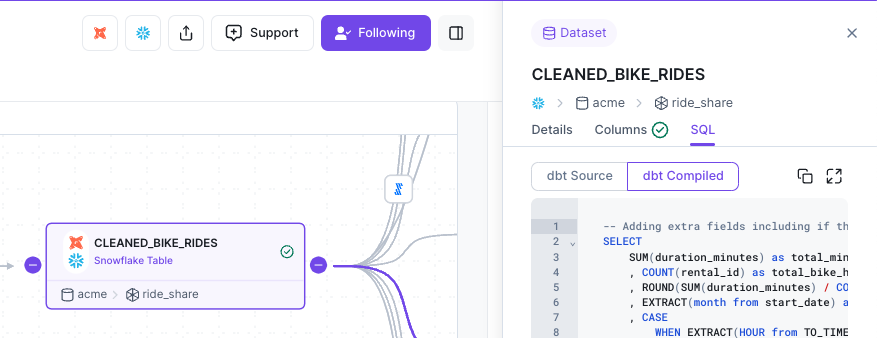
A similar query for SQL backed Tableau datasources also show up.
Load More
→